How to Create a 404 Monitoring Report in GA4
11/5/2025
Imagine someone clicks a link to your site, and instead of your content, they hit a dead end. They leave — and maybe don’t come back. That’s what a 404 error does. With this quick GA4 setup, you’ll see every broken page on your site and where it came from, so you can fix them fast.
-
Log into GA4
Open Google Analytics and select the GA4 property for the website you want to monitor.
-
Create a New Exploration
- Click the + icon to make a new exploration.
- Then choose the Free Form technique (it’s the simplest layout for this kind of report).
- At the top left, rename your report something like “404 Page Views”.
-
Add Your Dimensions and Metrics
- On the left, under Variables, you’ll see two sections: Dimensions (what the report should analyze) and Metrics (how to measure it).
- Under Dimensions, click the + and search for:
- Event Name
- Page Title
- Page Referrer
- Page Path and screen class
- Under Metrics, click the + and search for:
- Event Count
-
Build Your Report Layout in the Second Column
This is how we'll tell GA4 to display your data. Starting from the top, each section should look like this:
Technique
- Free Form
Visualization
- Table (the first option)
Segment Comparisons
- Leave this blank
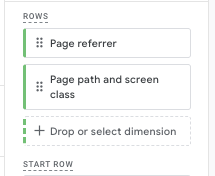
Rows
Look at your "Dimensions" section in the first column and click & drag the following into your Rows section.
- Page Referrer
- Page Path and screen class
It should look like this:
Start Row
- 1
Show Rows
- 100
Nested Rows
- No
Columns
- Skip this
Start Column Group
- 5
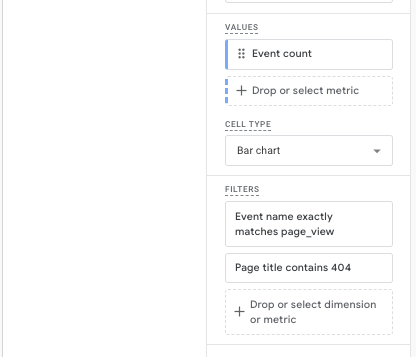
Values
Look at your "Metrics" section in the first column (it’s blue) and click & drag the following into your Values section.
- Event Count
Cell Type
- Bar Chart
Filters
- Event Name + exactly matches + page_view (Click Apply and add a second filter)
- Page title + contains + 404 (Click Apply)
Your report setup should look like this once you're done!